New Internal Revenue Service (IRS) data on individual income taxes for taxA tax is a mandatory payment or charge collected by local, state, and national governments from individuals or businesses to cover the costs of general government services, goods, and activities.
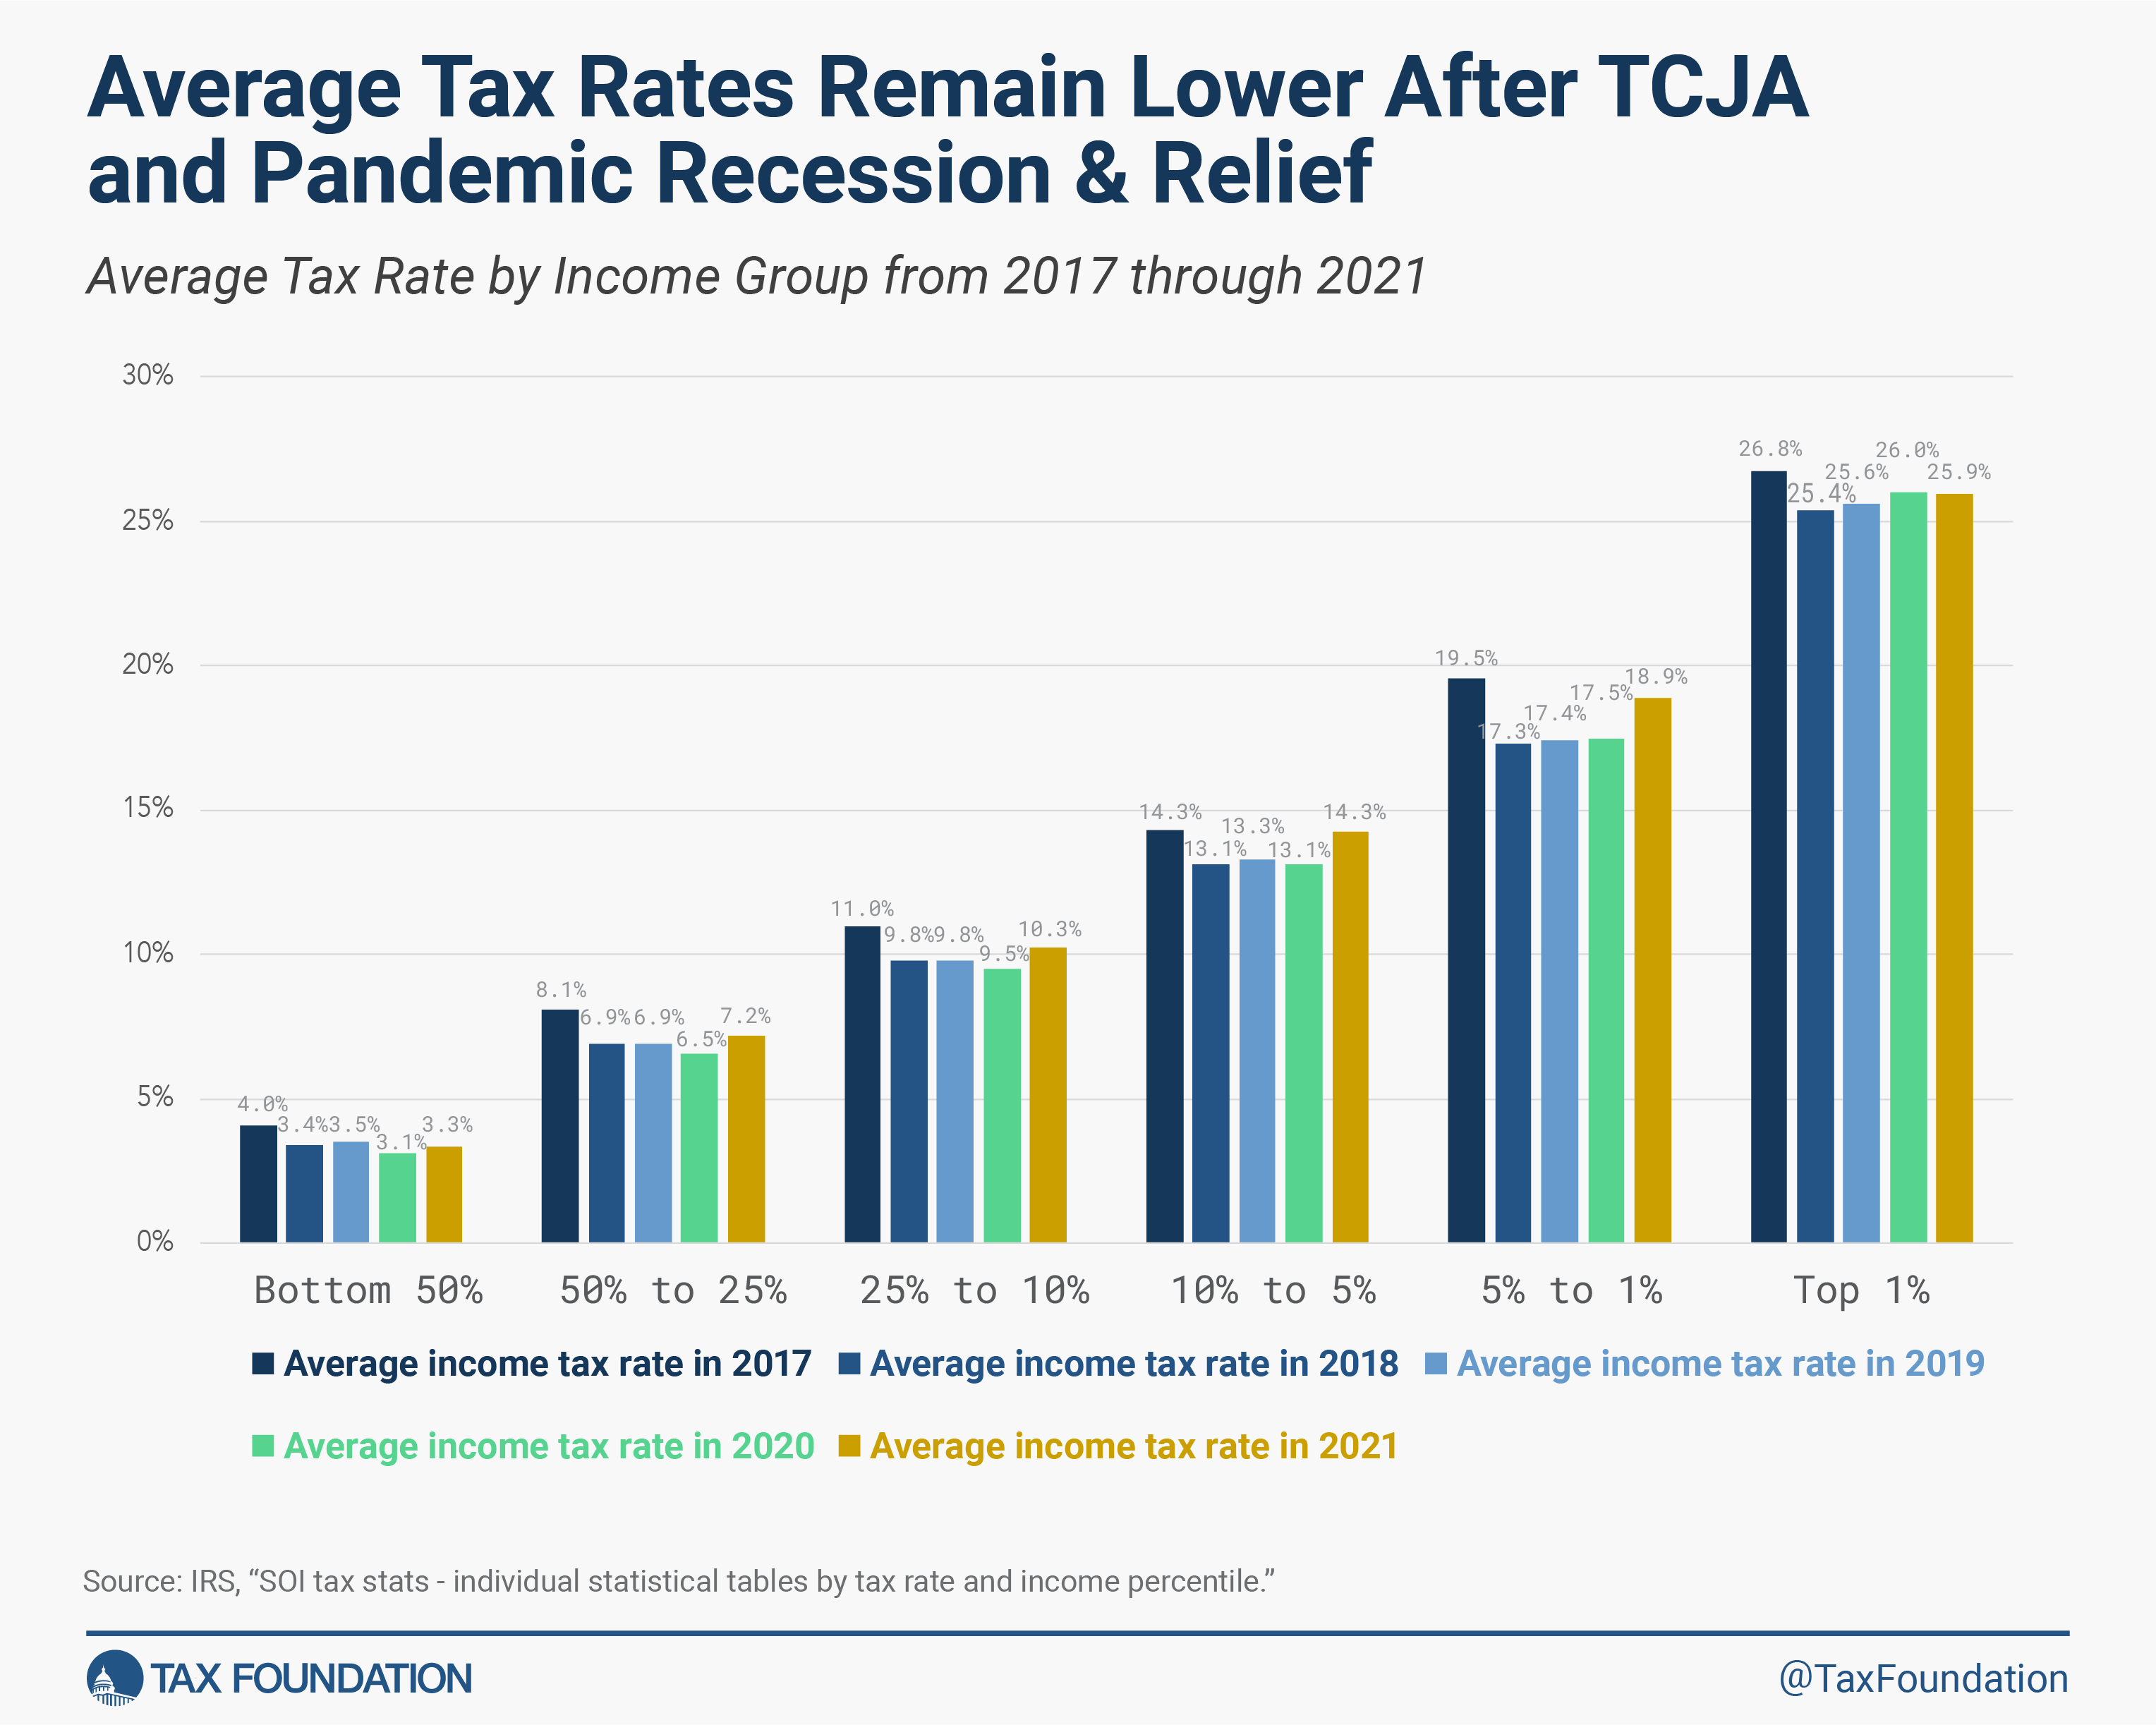
year 2021 shows the federal income tax system continues to be progressive as high-income taxpayers pay the highest average income tax rates. Average tax rates for all income groups remained lower in 2021, four years after the Tax Cuts and Jobs Act (TCJA), than they were in 2017 prior to the reform. The 2021 data also reflects changes in people’s incomes and in government policy during the coronavirus pandemic.
- In 2021, taxpayers filed 153.6 million tax returns, reported earning more than $14.7 trillion in adjusted gross income (AGI), and paid nearly $2.2 trillion in individual income taxes.
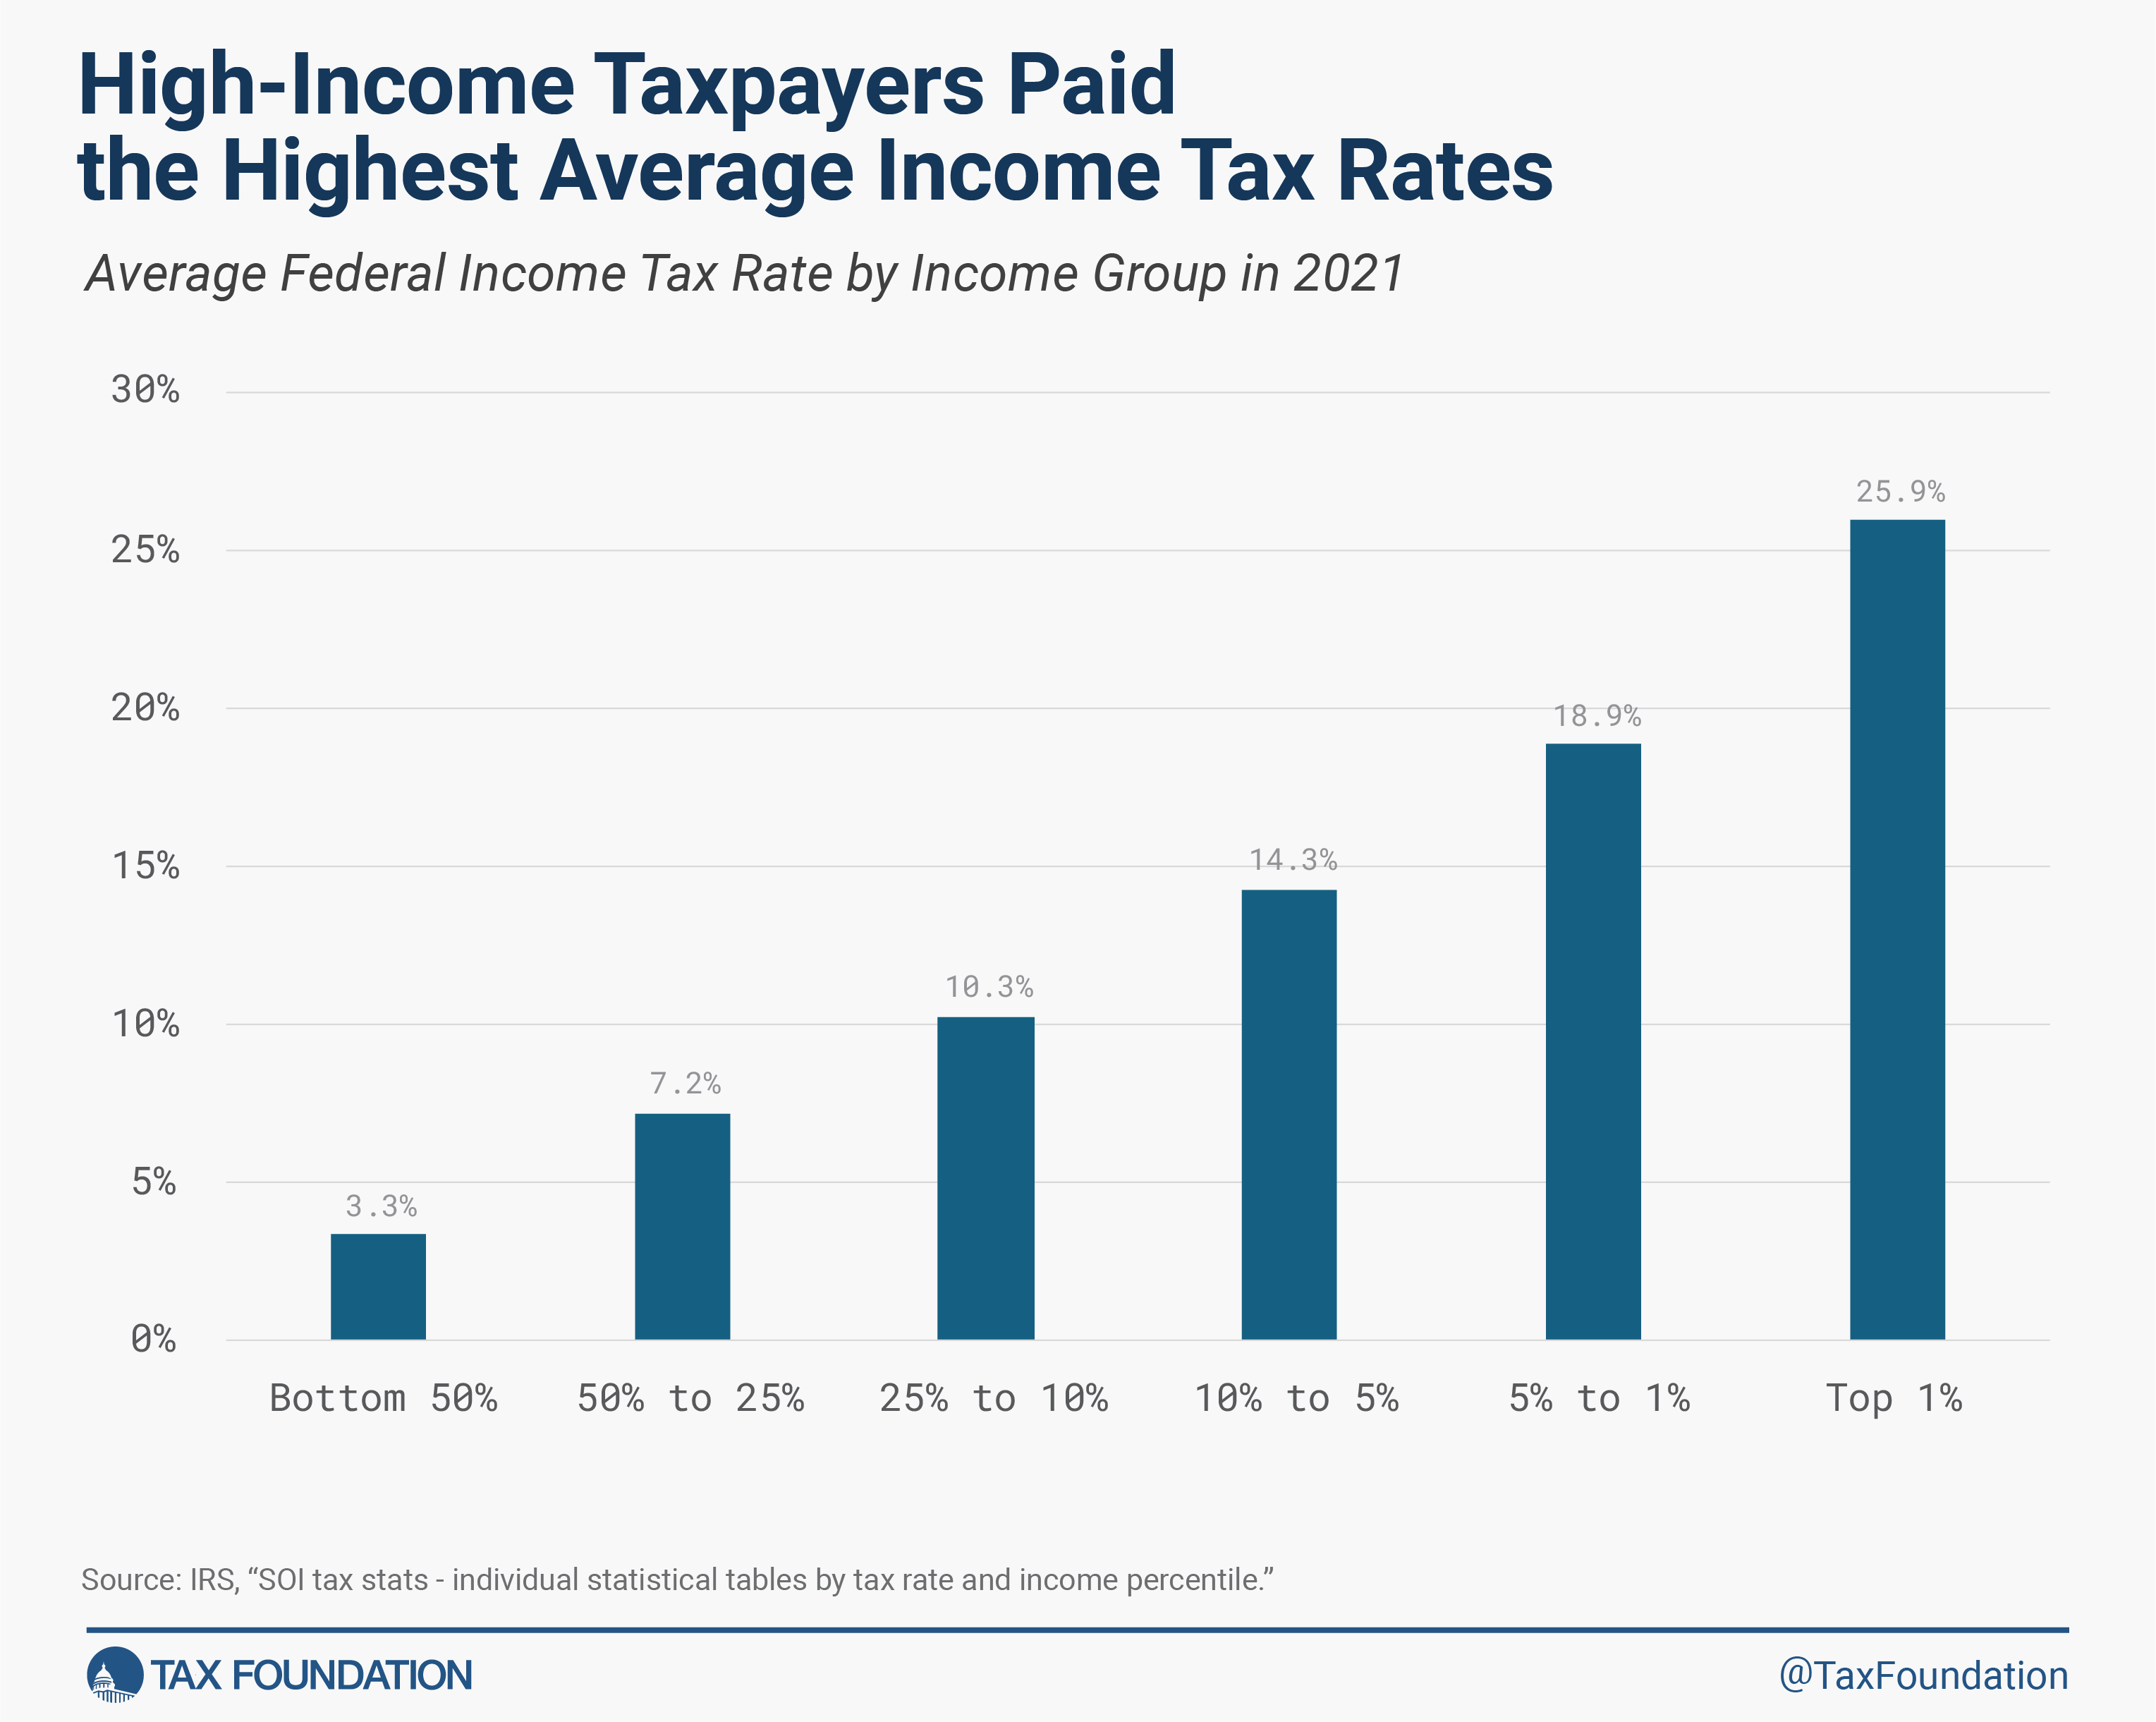
- The average income tax rate in 2021 was 14.9 percent. The top 1 percent of taxpayers paid a 25.9 percent average rate, nearly eight times higher than the 3.3 percent average rate paid by the bottom half of taxpayers.
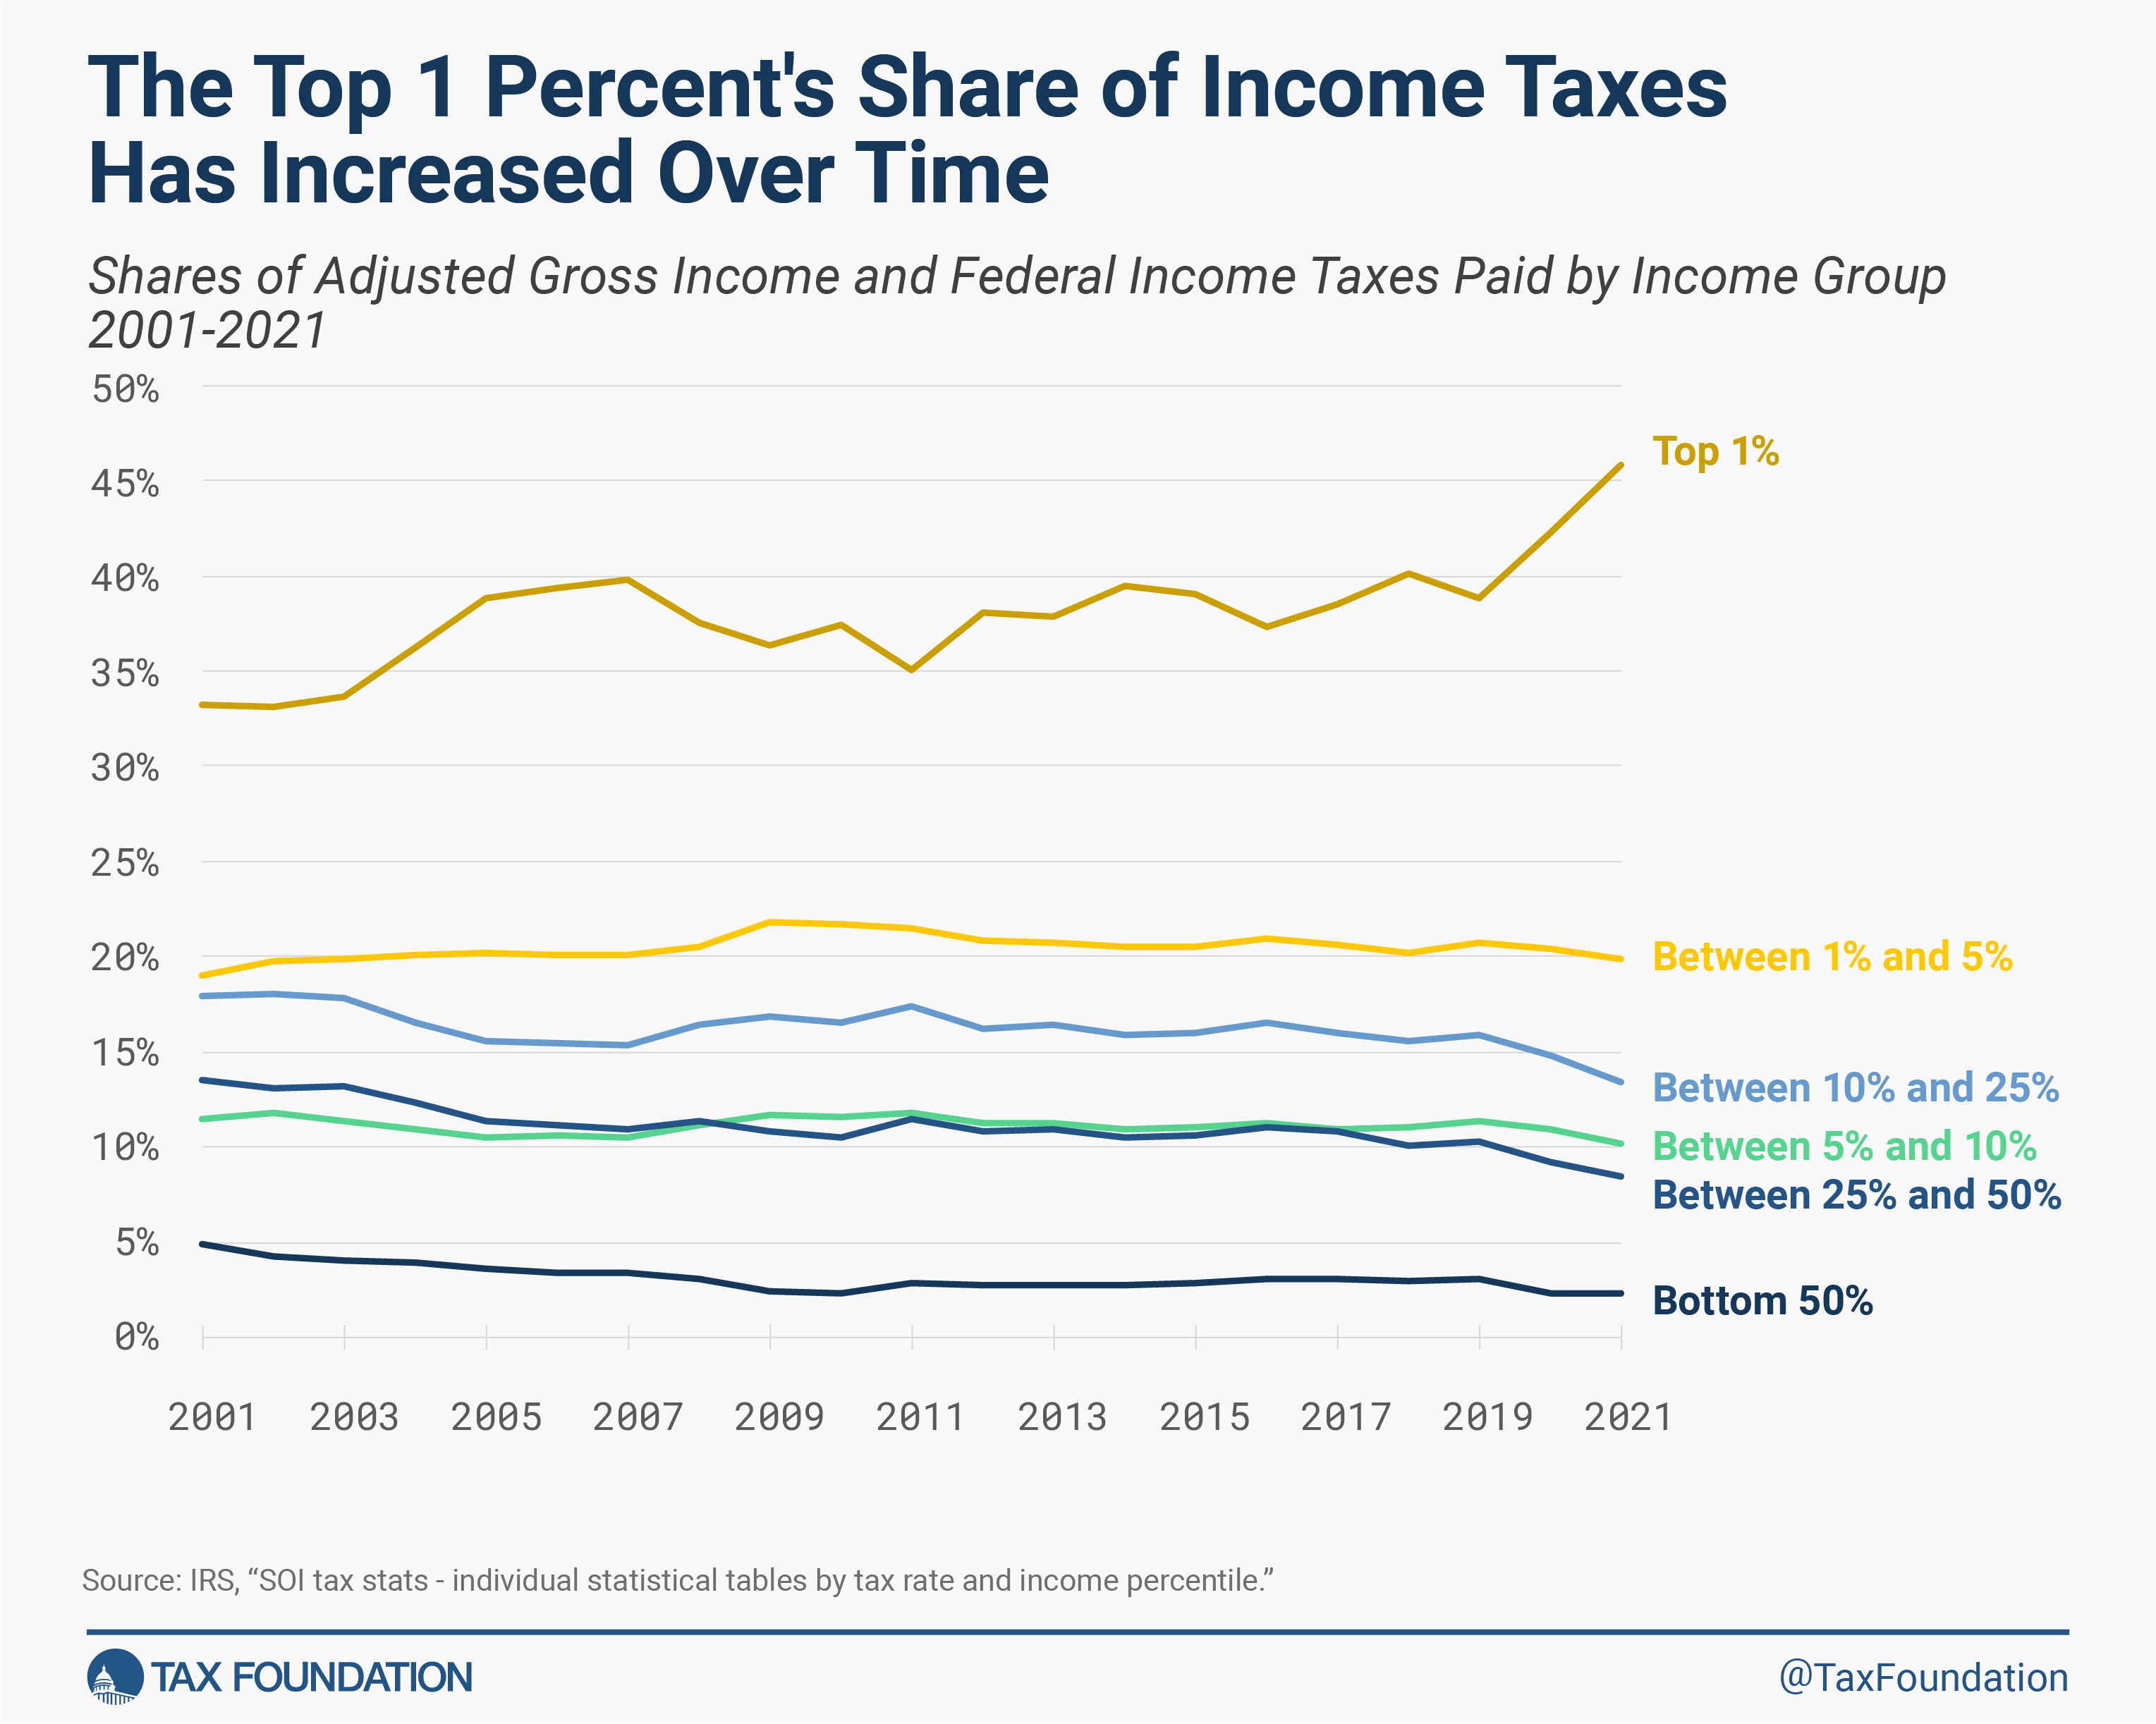
- The top 1 percent’s income share rose from 22.2 percent in 2020 to 26.3 percent in 2021 and its share of federal income taxes paid rose from 42.3 percent to 45.8 percent.
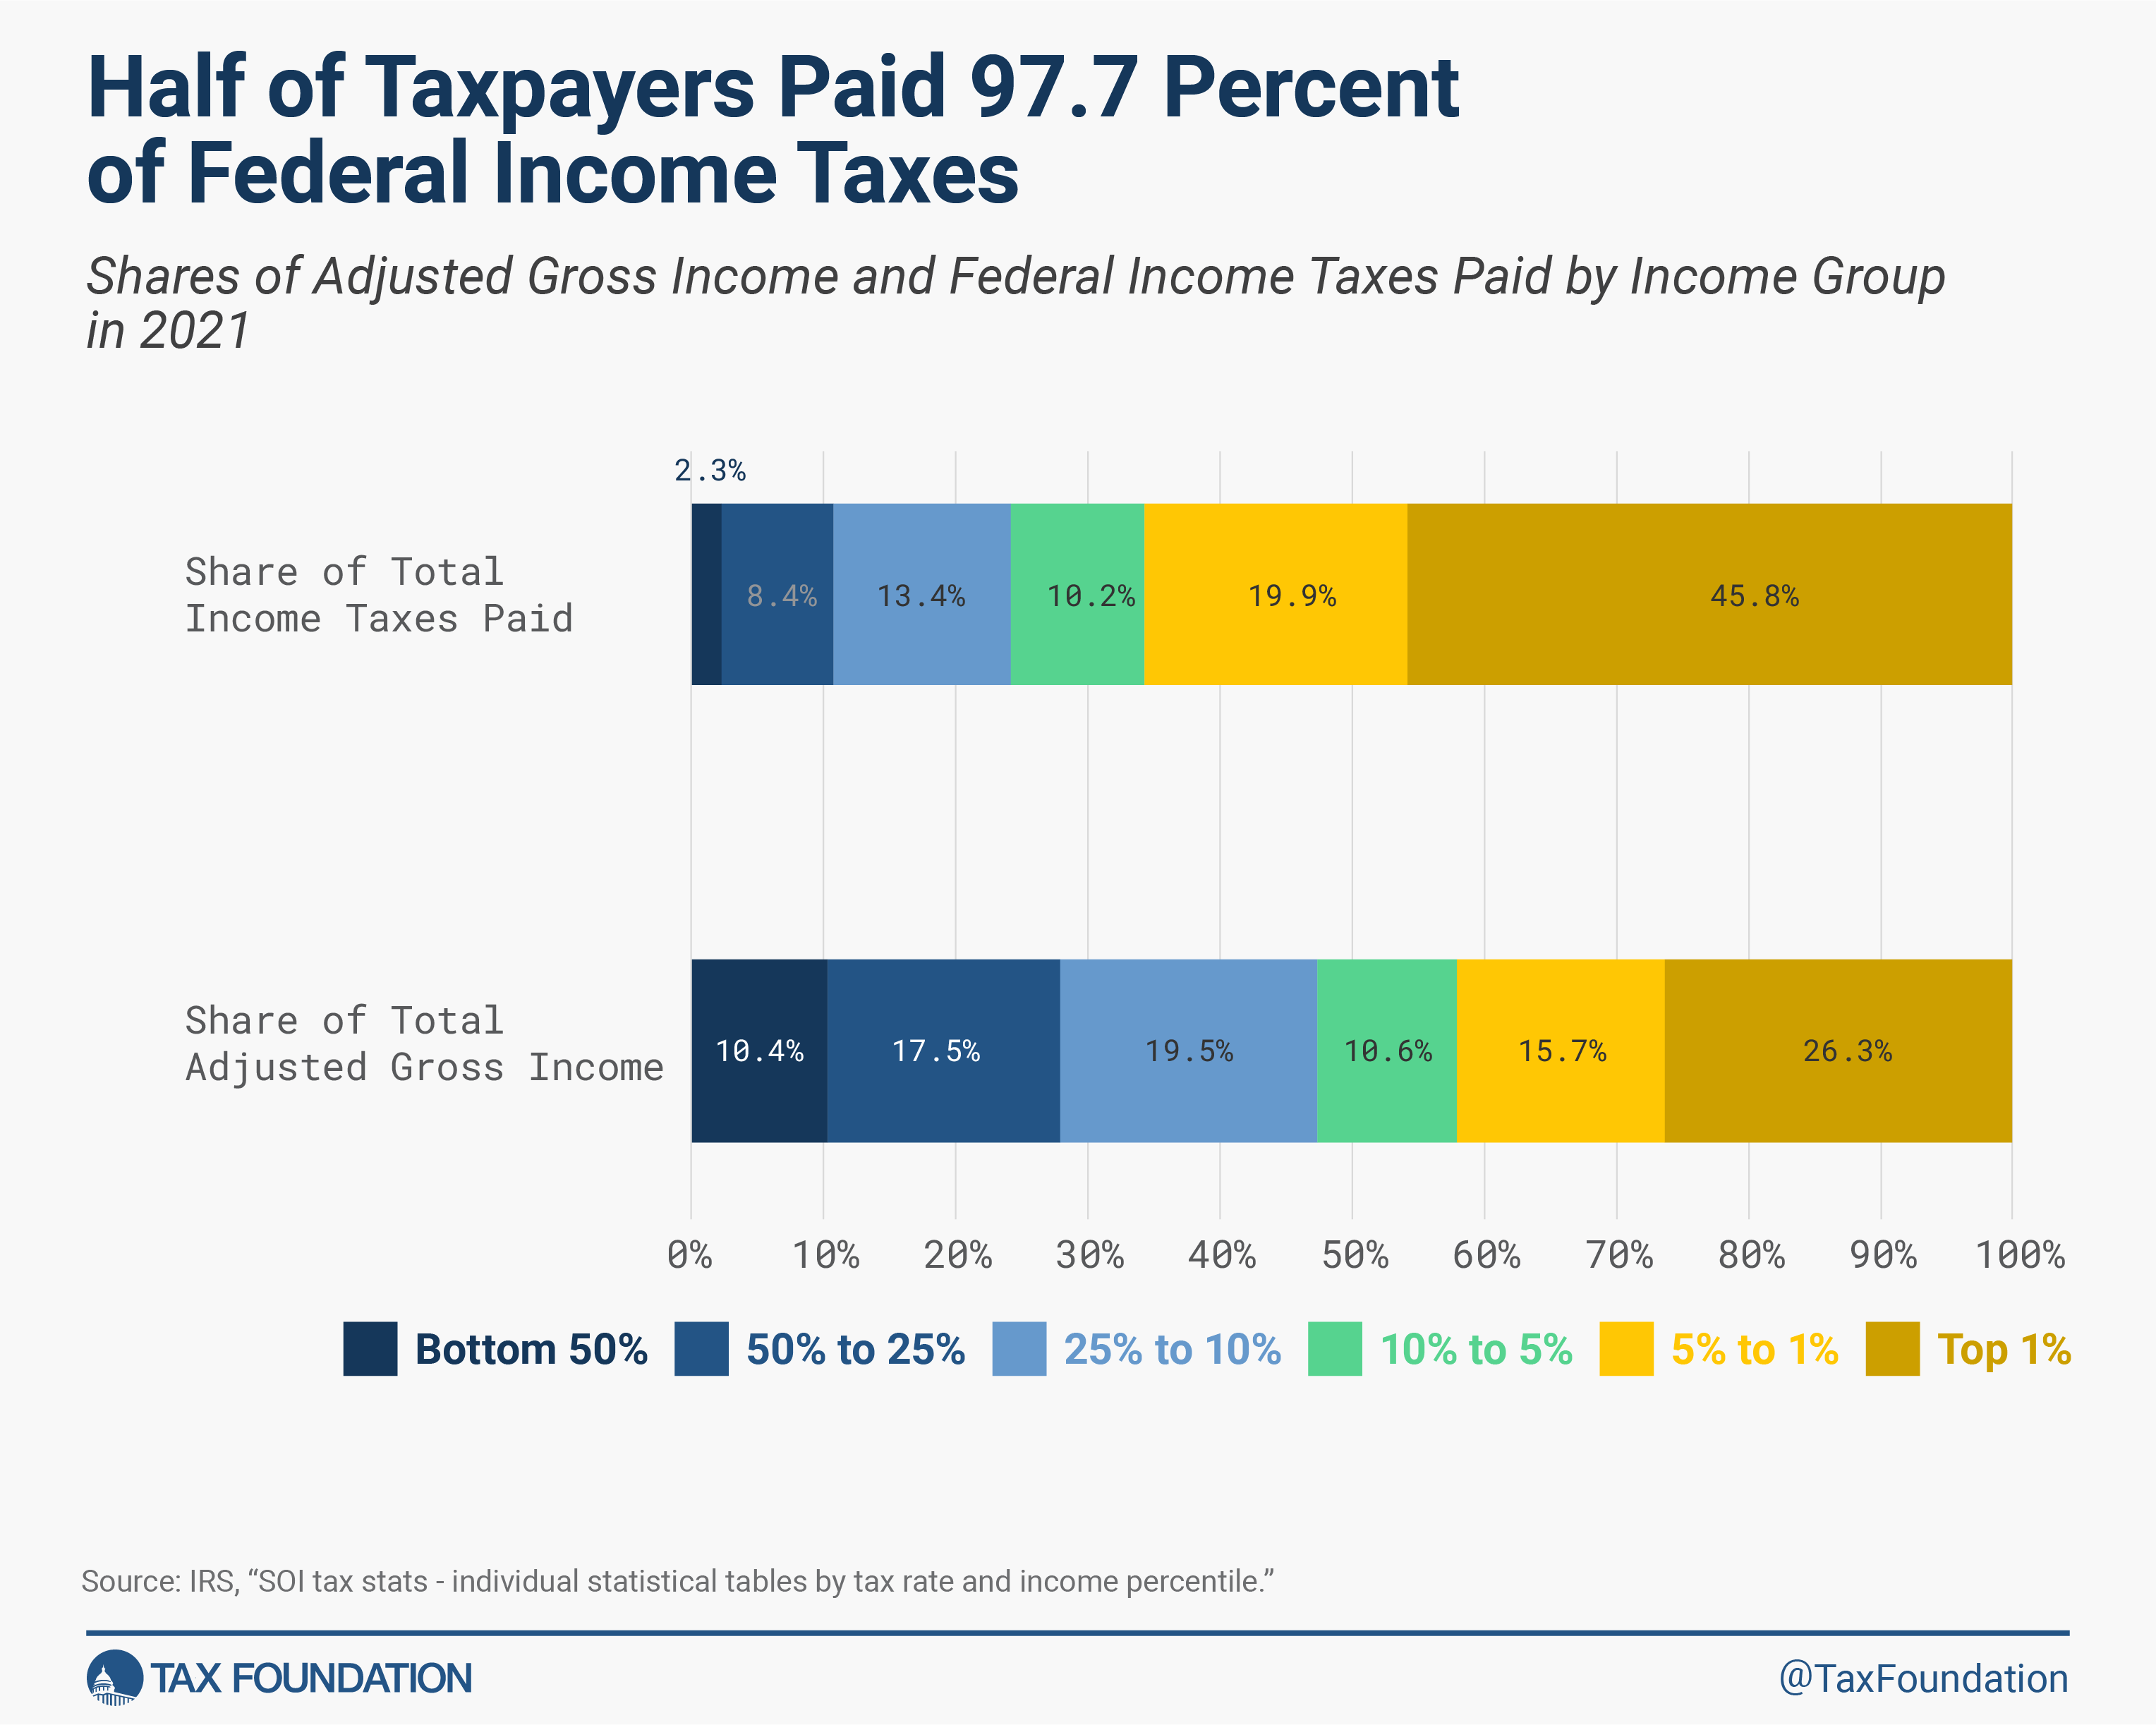
- The top 50 percent of all taxpayers paid 97.7 percent of all federal individual income taxes, while the bottom 50 percent paid the remaining 2.3 percent.
- The 2021 figures include pandemic-related tax items from the American Rescue Plan Act (ARPA), such as the non-refundable part of the third round of Recovery Rebates and the expanded child tax creditA tax credit is a provision that reduces a taxpayer’s final tax bill, dollar-for-dollar. A tax credit differs from deductions and exemptions, which reduce taxable income, rather than the taxpayer’s tax bill directly.
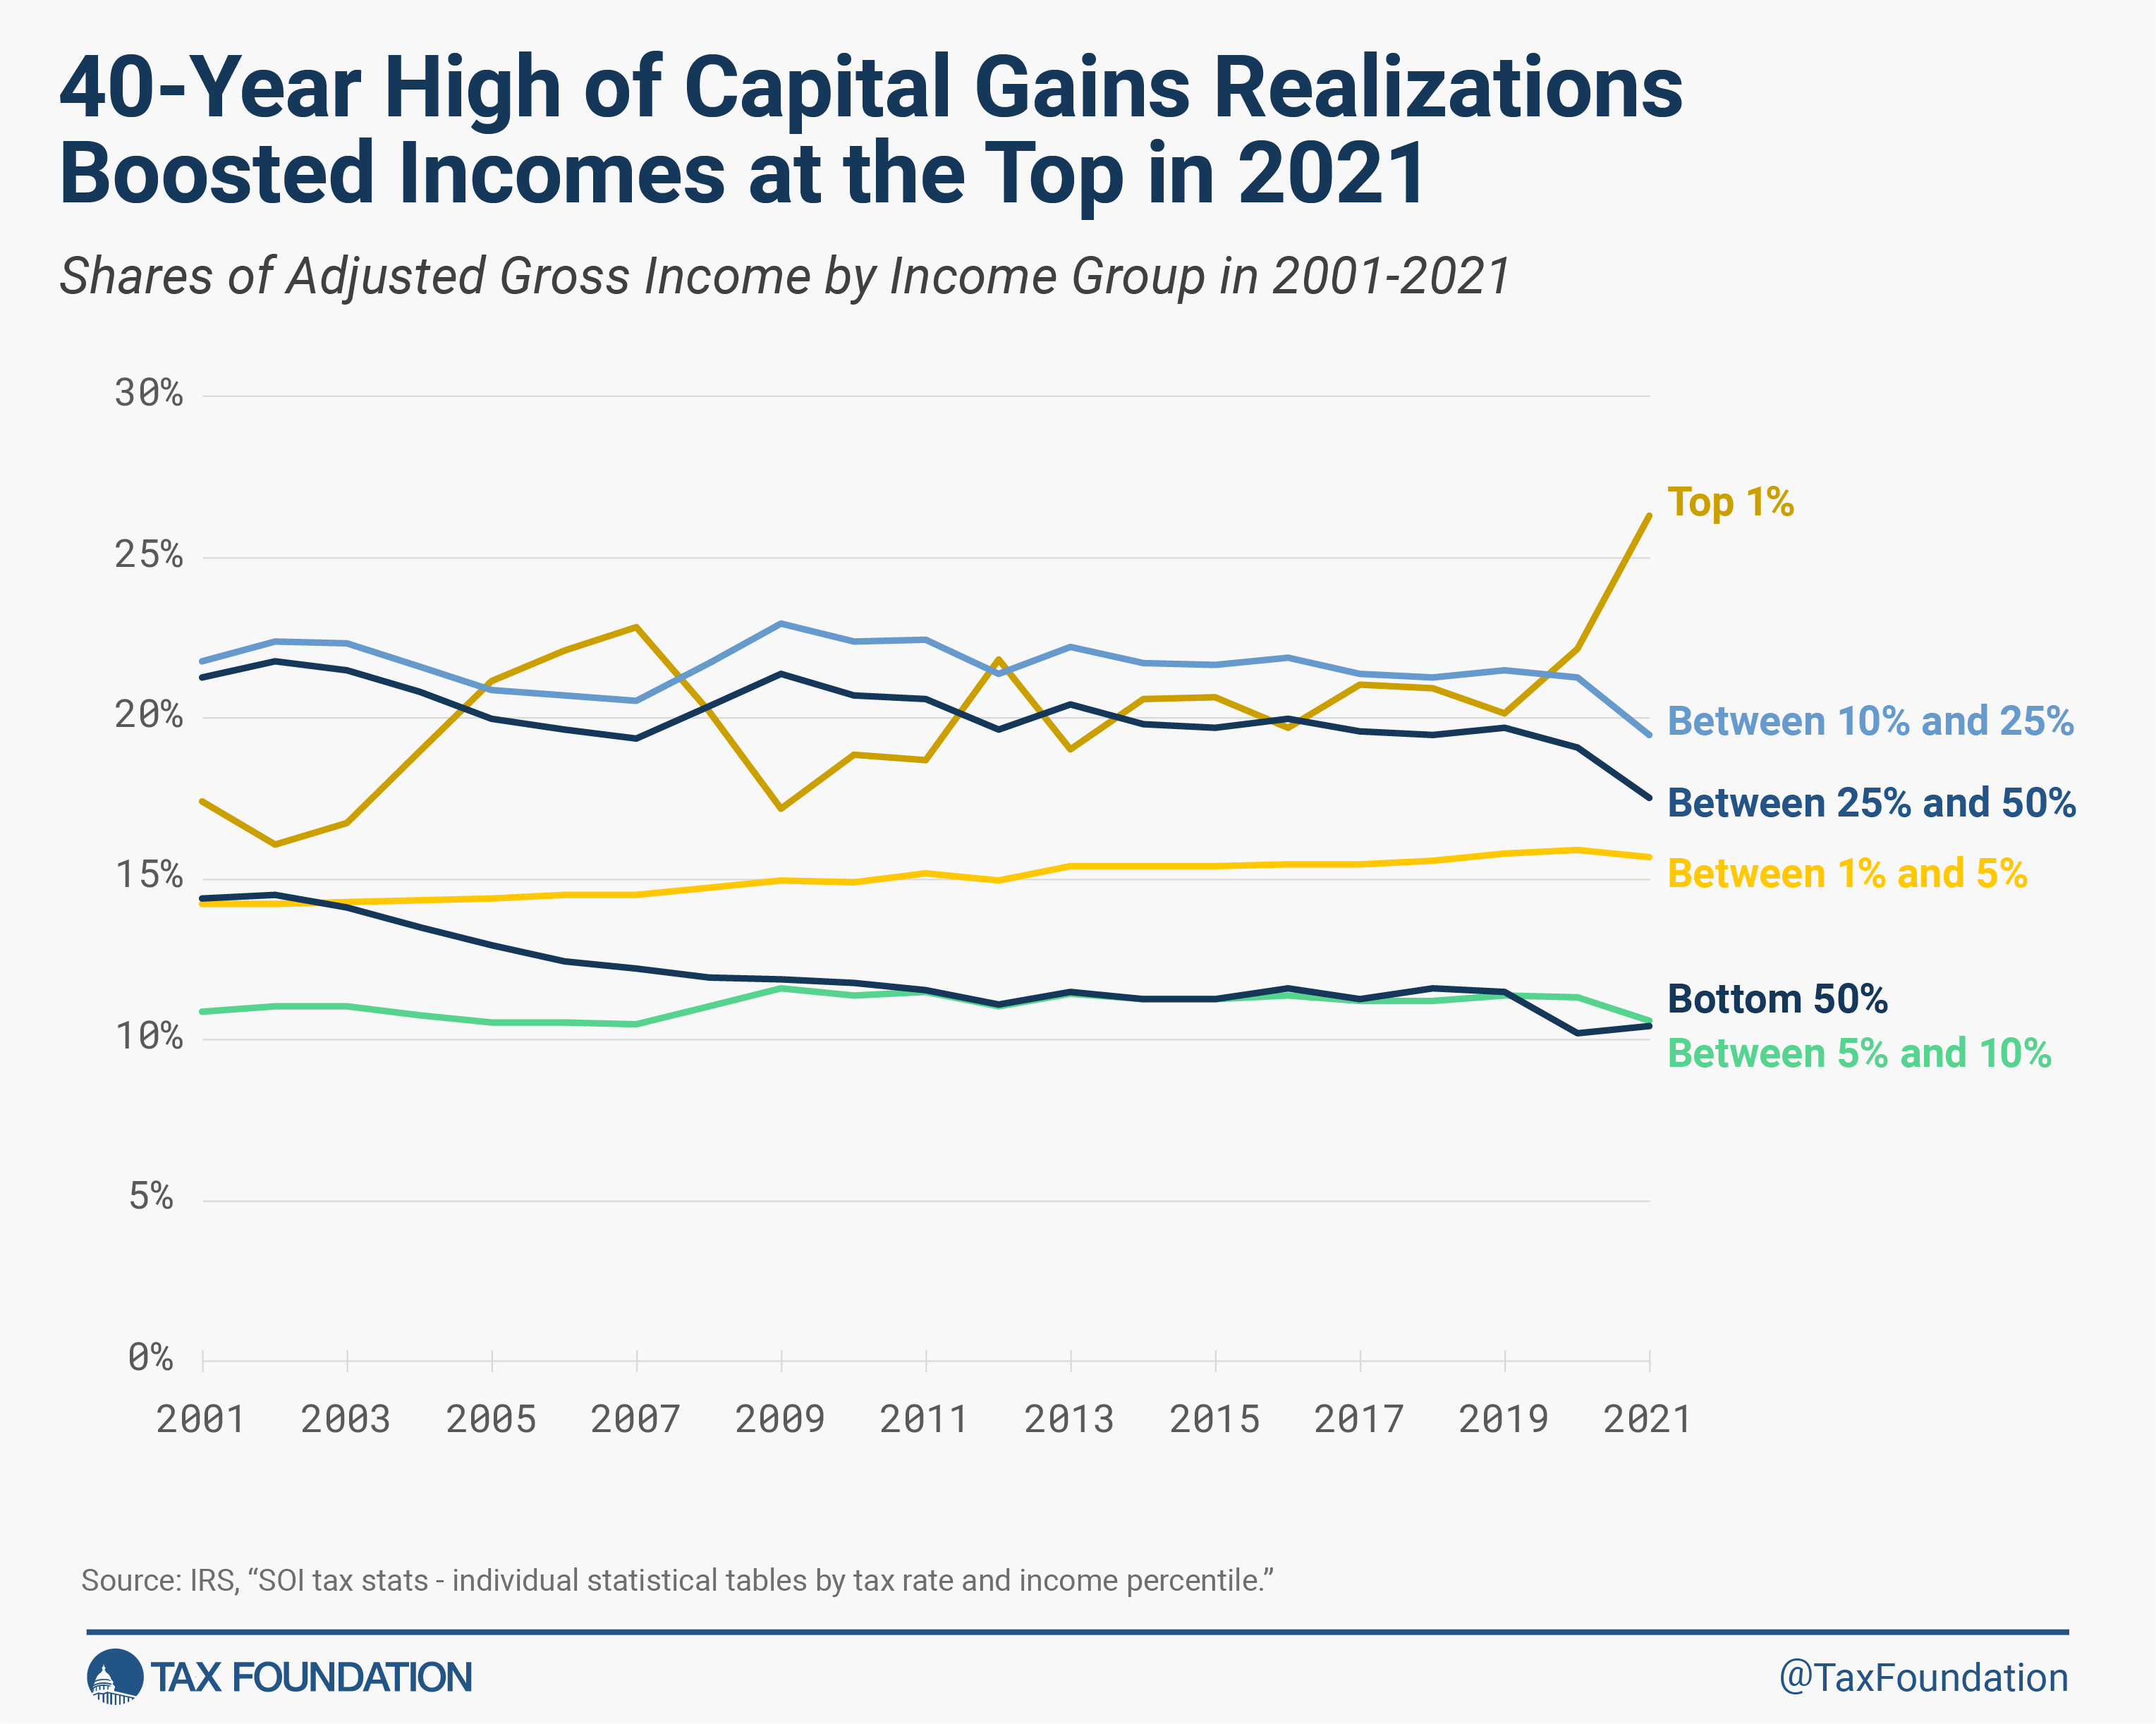
(CTC) and earned income tax credit (EITC). - Capital gains realizations exceeded $2 trillion to reach a 40-year high, driving income growth and taxes paid for high-income groups.
Reported Income and Taxes Paid Increased in Tax Year 2021
Taxpayers reported more than $14.7 trillion in AGI on 153.5 million tax returns in 2021, an increase of nearly $2.2 trillion in AGI and a decrease of 3.9 million in returns compared to 2020. Total income taxes paid rose by $485 billion to nearly $2.2 trillion, a 28 percent increase above 2020. The average individual income taxAn individual income tax (or personal income tax) is levied on the wages, salaries, investments, or other forms of income an individual or household earns. The U.S. imposes a progressive income tax where rates increase with income. The Federal Income Tax was established in 1913 with the ratification of the 16th Amendment. Though barely 100 years old, individual income taxes are the largest source of tax revenue in the U.S.
rate inched up from 13.6 percent in 2020 to 14.9 percent in 2021.
Because the Office of Management and Budget (OMB) classifies the refundable part of tax credits as spending, the IRS does not include it in tax share figures. The result overstates the tax burden of the bottom half of taxpayers.
Pandemic-Related Downturn and Relief Programs
The pandemic-related downturn and relief programs both affect the 2021 data. After dropping by 6.6 percent from 2019 to 2020, AGI reported by the bottom half of taxpayers increased by 20 percent in 2021. The top half of taxpayers saw a 7 percent increase in AGI from 2019 to 2020 and a 17 percent increase in 2021. The American Rescue Plan Act (ARPA) provided a third round of recovery rebates of up to $1,400 per eligible individual and dependent, phasing out for single taxpayers with incomes above $75,000 and joint filers with incomes above $150,000. The ARPA also expanded premium tax credits, the child tax credit (CTC) to a maximum of $3,000 (with an extra $600 for children under age 6) that was fully refundable and available to households without earned income, and the earned income tax credit (EITC) for filers without qualifying children.
From 2020 to 2021, AGI grew across all income groups on average, but grew faster across higher income groups. A large part of that year-over-year income growth was from a significant increase in capital gains realizations after a strong year of stock market performance. Higher growth at higher income levels, combined with significant expansions of tax credits for middle- and lower-income groups, resulted in a larger share of income reported and taxes paid at the top and a higher average income tax rate overall..
The bottom half of taxpayers, or taxpayers making under $46,637, faced an average income tax rate of 3.3 percent. As household income increases, average income tax rates rise. For example, taxpayers with AGI between the 10th and 5th percentiles ($169,800 and $252,840) paid an average income tax rate of 14.3 percent—four times the rate paid by taxpayers in the bottom half.
The top 1 percent of taxpayers (AGI of $682,577 and above) paid the highest average income tax rate of 25.93 percent—nearly eight times the rate faced by the bottom half of taxpayers.
High-Income Taxpayers Paid the Highest Average Income Tax Rates
In 2021, taxpayers with higher incomes paid much higher average income tax rates than taxpayers with lower incomes.
The bottom half of taxpayers, or taxpayers making under $46,637, faced an average income tax rate of 3.3 percent. As household income increases, average income tax rates rise. For example, taxpayers with AGI between the 10th and 5th percentiles ($169,800 and $252,840) paid an average income tax rate of 14.3 percent—four times the rate paid by taxpayers in the bottom half.
The top 1 percent of taxpayers (AGI of $682,577 and above) paid the highest average income tax rate of 25.93 percent—nearly eight times the rate faced by the bottom half of taxpayers.
High-Income Taxpayers Paid the Majority of Federal Income Taxes
In 2021, the bottom half of taxpayers earned 10.4 percent of total AGI and paid 2.3 percent of all federal individual income taxes. The top 1 percent earned 26.3 percent of total AGI and paid 45.8 percent of all federal income taxes.
In all, the top 1 percent of taxpayers accounted for more income taxes paid than the bottom 90 percent combined. The top 1 percent of taxpayers paid more than $1 trillion in income taxes while the bottom 90 percent paid $531 billion.
The share of income taxes paid by the top 1 percent increased from 33.2 percent in 2001 to 45.8 percent in 2021. While the share has generally been increasing over the period, 2020 and 2021 are outlier years largely because of the changes in income and in tax policy during the coronavirus pandemic. Over the same period, the share paid by the bottom 50 percent of taxpayers fell from 4.9 percent to just over 2.3 percent in 2021.
Similarly, the share of adjusted gross income reported by the top 1 percent increased from 22.2 percent in 2020 to 26.3 percent in 2021. The AGI share of the top 1 percent tends to fluctuate over the business cycle, rising and falling to a greater extent than income reported by other groups. This was particularly the case in 2021 as capital gains realizations increased sharply to reach their highest level in 40 years. The share of AGI reported by the bottom 50 percent of taxpayers fell from 14.4 percent in 2001 to 10.4 percent in 2021 (a slight uptick from its share in 2020).
The Tax Cuts and Jobs Act Reduced Average Tax RateThe average tax rate is the total tax paid divided by taxable income. While marginal tax rates show the amount of tax paid on the next dollar earned, average tax rates show the overall share of income paid in taxes.
s across Income Groups
The 2021 tax year was the fourth since the Tax Cuts and Jobs Act (TCJA) made many significant, but temporary, changes to the individual income tax code to lower tax rates, widen brackets, increase the standard deductionThe standard deduction reduces a taxpayer’s taxable income by a set amount determined by the government. It was nearly doubled for all classes of filers by the 2017 Tax Cuts and Jobs Act (TCJA) as an incentive for taxpayers not to itemize deductions when filing their federal income taxes.
and child tax credit, and more. The changes lowered tax burdens, on average, for taxpayers across all income levels. In 2021, tax relief in the form of expanded tax credits also affected average tax rates of middle- and lower-income taxpayers, though the IRS does not include the impact of the refundable portion of tax credits in its dataset. Average tax rates were lower in 2021 than in 2017 across all income groups.
Stay informed on the tax policies impacting you.
Subscribe to get insights from our trusted experts delivered straight to your inbox.
Appendix
For data prior to 2001, all tax returns that have a positive AGI are included, even those that do not have a positive income tax liability. For data from 2001 forward, returns with negative AGI are also included, but dependent returns are excluded. The unit of analysis is the tax return. In the figures prior to 2001, some dependent returns are included. Under other units of analysis (like the U.S. Treasury Department’s Family Economic Unit), these returns would likely be paired with parents’ returns.
Income tax after credits (the measure of “income taxes paid” above) does not account for the refundable portion of tax credits such as the EITC. If the refundable portion were included, the tax share of the top income groups would be higher and the average tax rate of bottom income groups would be lower. The refundable portion is classified as a spending program by the Office of Management and Budget (OMB) and therefore is not included by the IRS in these figures.
The only tax analyzed here is the federal individual income tax, which is responsible for more than 25 percent of the nation’s taxes paid (at all levels of government). Federal income taxes are much more progressive than federal payroll taxes, which are responsible for about 20 percent of all taxes paid (at all levels of government), and are more progressive than most state and local taxes.
AGI is a fairly narrow income concept and does not include income items like government transfers (except for the portion of Social Security benefits that is taxed), the value of employer-provided health insurance, underreported or unreported income (most notably that of sole proprietors), income derived from municipal bond interest, net imputed rental income, and others.
These figures represent the legal incidence of the income tax. Most distributional tables (such as those from the Congressional Budget Office (CBO), the Tax Policy Center, Citizens for Tax Justice, the Treasury Department, and the Joint Committee on Taxation (JCT)) assume that the entire economic incidence of personal income taxes falls on the income earner.
Share