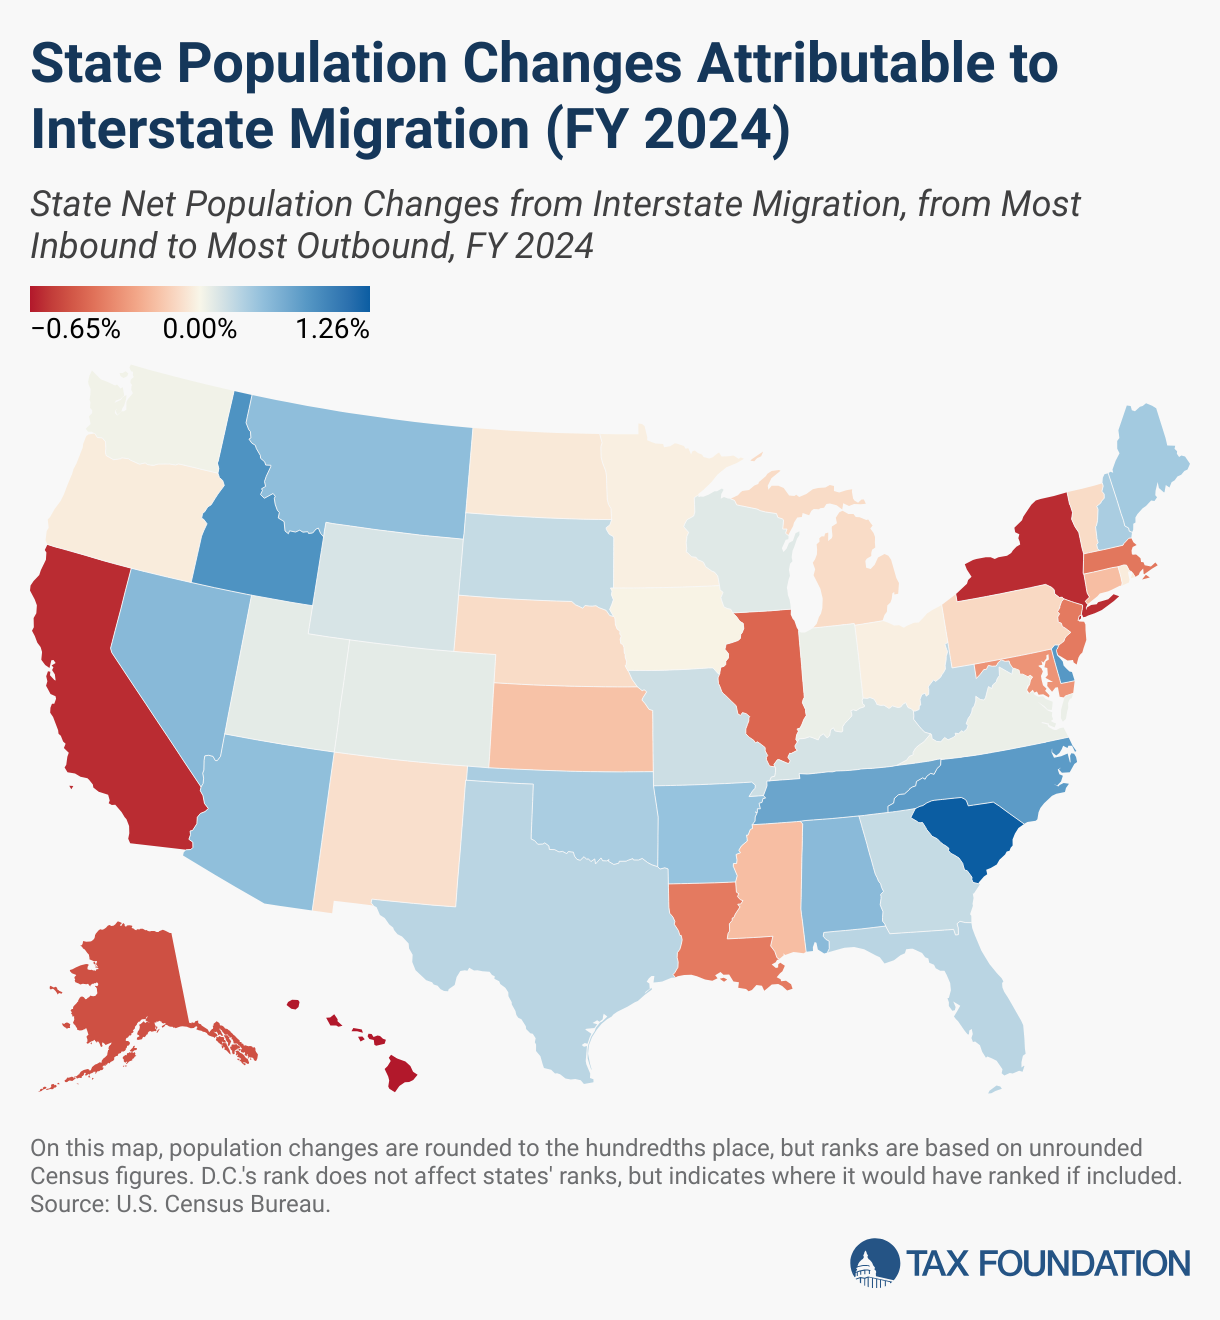
The moving companies’ datasets, while less robust than Census data—and undoubtedly influenced by these companies’ geographic coverage and relative market shares—show similar overall migration patterns. Unlike the Census data in the map above, which show the extent to which each state’s population grew or shrunk due to domestic net migration, the moving companies’ datasets show the ratio of inbound moves to outbound moves for each state, with the states with the highest inbound-to-outbound ratios ranking most favorably.
As in the Census data, South Carolina claimed the top spot in this year’s U-Haul study, with the highest ratio of inbound-to-outbound one-way U-Haul moves, followed by Texas, North Carolina, Florida, and Tennessee. At the other end of the spectrum, the states with the highest ratio of outbound-to-inbound moves were California, Massachusetts, New Jersey, New York, and Pennsylvania.
Meanwhile, among United Van Lines customers, the highest inbound-to-outbound moving ratios occurred in West Virginia, Delaware, South Carolina, the District of Columbia, and North Carolina, while the states with the highest outbound-to-inbound ratios were New Jersey, Illinois, New York, California, and Massachusetts.
Both companies saw states like California, New Jersey, New York, Illinois, and Massachusetts among the biggest losers, and states like South Carolina, North Carolina, Arizona, Idaho, Florida, Indiana, and Tennessee among the biggest winners.
These interstate moving data shed light on an ongoing trend: Americans are continuing to leave high-taxA tax is a mandatory payment or charge collected by local, state, and national governments from individuals or businesses to cover the costs of general government services, goods, and activities.
, high-cost-of-living states in favor of lower-tax, lower-cost alternatives. Of the 26 states whose overall state and local tax burdens per capita were below the national average in 2022 (the most recent year of data available), 18 experienced net inbound interstate migration in FY 2024. Meanwhile, of the 25 states and DC with tax burdens per capita at or above the national average, 17 of those jurisdictions experienced net outbound domestic migration.
Though only one component of overall tax burdens, the individual income tax is particularly illustrative here. In the top third of states for highest domestic migration-related population growth, the average combined top marginal state income tax rate is about 3.5 percent. In the bottom third, it’s 3.2 percentage points higher, at about 6.7 percent.
Six states in the top third do not levy an individual income taxAn individual income tax (or personal income tax) is levied on the wages, salaries, investments, or other forms of income an individual or household earns. The U.S. imposes a progressive income tax where rates increase with income. The Federal Income Tax was established in 1913 with the ratification of the 16th Amendment. Though barely 100 years old, individual income taxes are the largest source of tax revenue in the U.S.
at all: Tennessee, Nevada, New Hampshire, Florida, Texas, and South Dakota. Among the bottom third, four states—Hawaii, New York, California, and New Jersey—have double-digit income tax rates, and (excepting Alaska, with no income tax), the lowest rate is in Pennsylvania, where a low state rate of 3.07 percent is paired with some of the highest local income tax rates in the country.
Just as states with lower income tax rates—or no income tax at all—have proven highly attractive to interstate movers, so have states with more neutral tax structures. Of the 12 states that levied single-rate, as opposed to graduated-rate, taxes on wage and salary income in 2024, all but four (Illinois, Mississippi, Pennsylvania, and Michigan) experienced net inbound migration. It is also worth noting that in the 2025 State Tax Competitiveness Index, which evaluates the competitiveness of state tax structures as of July 1, 2024, of the 25 top-ranking states, 20 experienced net inbound migration. Meanwhile, of the 25 lowest-ranking states on the Index, 17 and DC experienced net outbound migration.
For some Americans—especially higher-income and highly mobile individuals—tax differentials among states directly influence location decisions. More commonly, however, many individuals cite job opportunities, cost of living, family reasons, or lifestyle reasons for moving from one state to another. While taxes are far from the only factor affecting the cost of living or the job opportunities available in a state, they are an important factor, and they are one that is directly within policymakers’ control.
Furthermore, in the post-pandemic era of increased remote and hybrid workplace flexibility, more Americans now enjoy the flexibility to live in a state of their preference while working for an employer located elsewhere. Many states have responded to this highly competitive landscape by reducing tax rates and improving tax structures in an effort to attract and retain individuals and employers. In recent years, several states that recently had highly uncompetitive tax codes—like Iowa, Louisiana, and Arkansas—have taken significant steps to improve their tax structures and better compete with their lower-tax neighbors. Other states—especially those that experience net outbound migration year after year—should consider following suit or risk falling behind simply by standing still.
Many policies, such as minimum wage levels, tax bracketsA tax bracket is the range of incomes taxed at given rates, which typically differ depending on filing status. In a progressive individual or corporate income tax system, rates rise as income increases. There are seven federal individual income tax brackets; the federal corporate income tax system is flat.
, and means-tested public benefit income thresholds, are denominated in nominal dollars, even though a dollar in one region may go much further than a dollar in another. Lawmakers should keep that reality in mind as they make changes to tax and economic policies.
